|
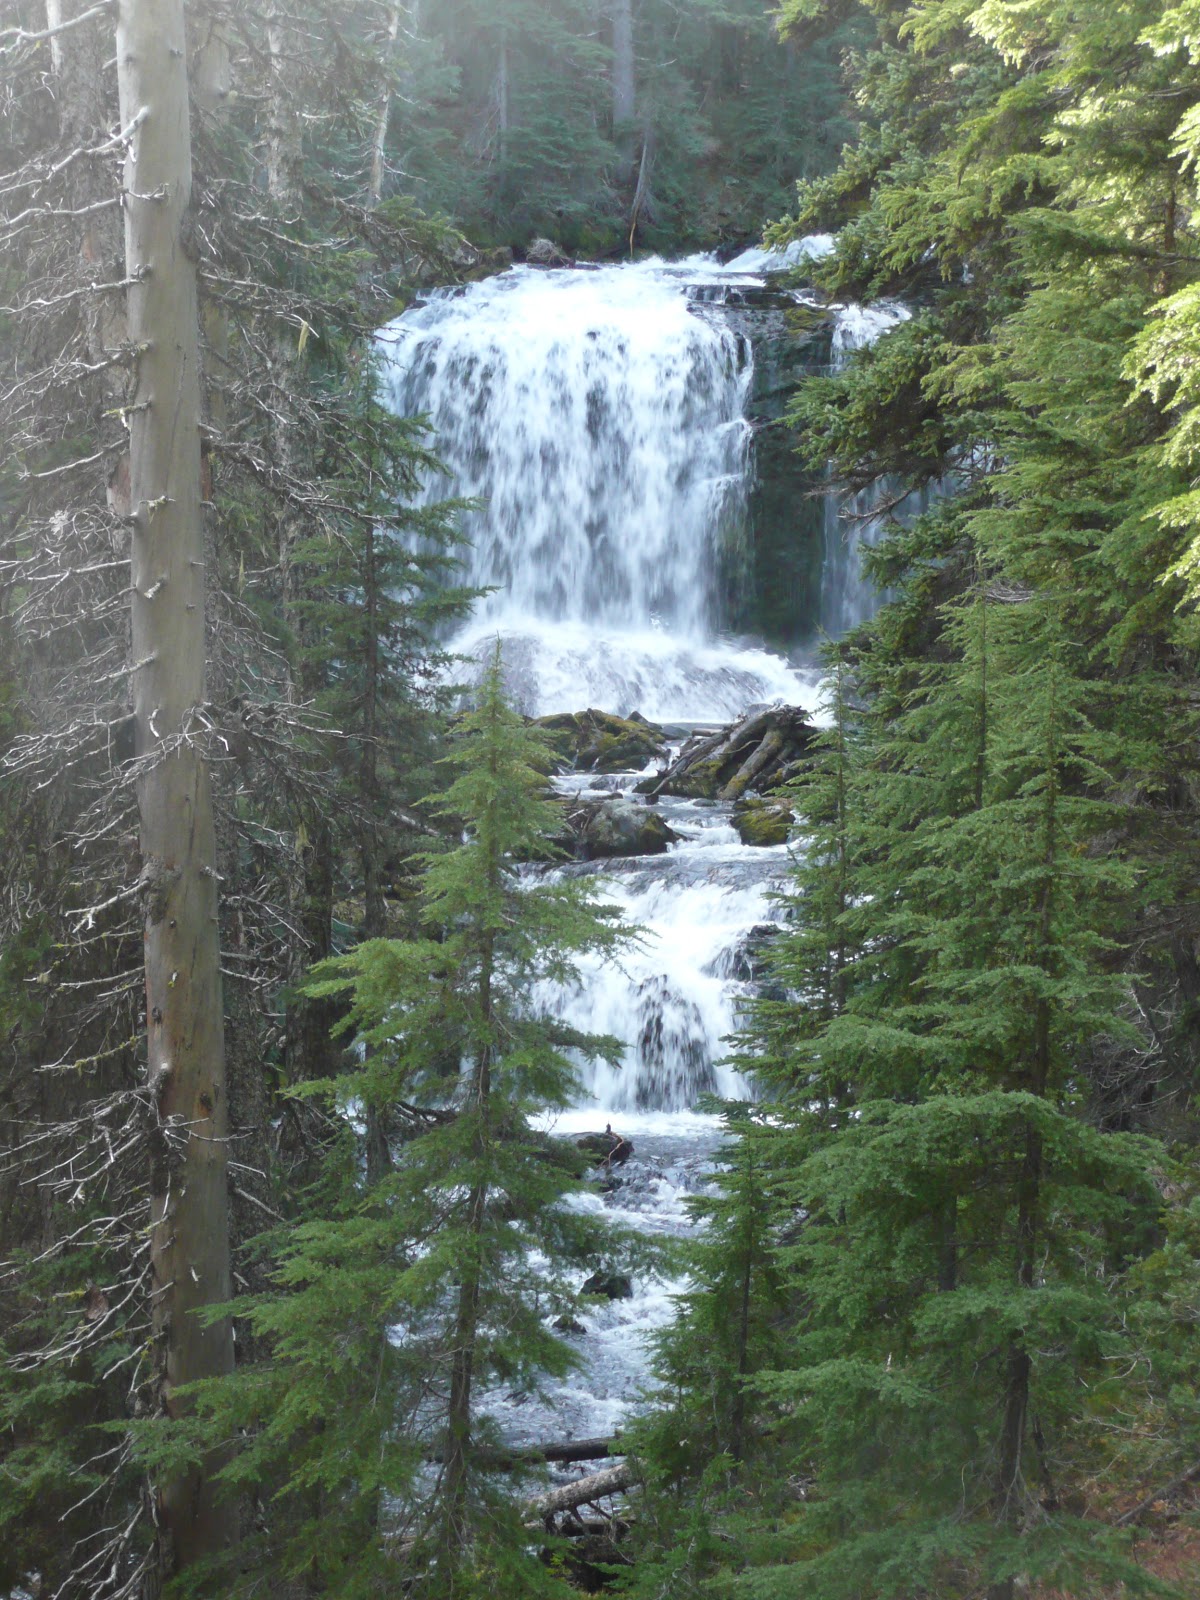
| 9 miles into the JFK 50 course on the AT |
Having just got back from the 50th annual JFK50
(see a great history of the race here), it was an honor
to be part of the event, especially with course records being destroyed (see results). It got me thinking about the comparability of race times
between road and trail races, plus different distances.
 |
| On a training run the day before the race it's easy to bump into half the Montrail North American team and a whole bunch of Canadian speedsters. |
For interest, here’s the JFK course profile which includes
around 3,000ft of ascent and a little more descent. It has roads or canal path
easy trails for all but 11 miles, of which there’s a really fun 10-mile section
on the Appalachian Trail which is quick and generally not technical except for
maybe 3-4 miles of rockiness. I may write up a report of the race, but there are a few of those around from others who had more interesting days out on the trail. In summary, I loved the AT and jogged through that then sped up on the canal path before getting slight stomach problems (rare for me) and couldn't get motoring so just kept up the best pace I could and mainly ran solo, finishing 4th in 5:50.

Predicting finish times from one ultra to another
One stat I’d heard at the Miwok 100k in California is that
if you double your time from that race you get your Western States 100 mile
finish time. Although broadly true there’s a lot of variation, plus that
assumes having a good day at both races. It’s glaringly obvious that there’s a
large degree of individual impact on how well, say, a marathon time translates
to a flat ultra and even more so to a mountainous one. But JFK brought some of
the fastest runners ever to a US trail 50-miler – Trent Briney ran a 2:12 marathon and
has been the US alternate for the Olympic marathon (he got 2nd and
broke the CR); Max King runs a 2:14 and took almost 6 mins off the record;
Emily Harrison runs a 2:32 and smashed the women’s record, but not by as much
as 2:42 marathoner Ellie Greenwood; plus there were a lot more guys with 2:2x
marathons, not least David Riddle who came 3rd and held the record
from last year.
Ultras like Comrades, UROC 100k, JFK 50 and American River
50 have plenty of fast road sections (or trails that are almost as quick) so they favor a fast marathoner who also trains for ultras. But there’s a lot more
that comes into it too (as anyone reading this will certainly know). A quick
comparison of some of the fastest ultra courses for people who’ve run them at
the front shows road speed is fairly important, but more so the shorter the
race. I’m biasing this towards courses I’ve personally done so I can
legitimately compare them.
Comparison of PRs* for
selected runners over multiple fast ultra courses:
Marathon (26.2)
|
JFK (50.2)
|
American
River (50)
|
Comrades Down Run (55.5)
|
UROC (60+** 2012 course)
|
100k
Roads (62.2)
|
Rocky
Raccoon (100)
|
Western
States (100.2***)
|
|
Eric
Clifton
|
?
|
5:46
|
6:23 (Age 40)
|
?
|
Not raced
|
?
|
13:16
|
22:13
|
Max
King
|
2:14
|
5:34
|
6:01 (Bad day)
|
Not raced
|
7:57
|
No 100k
|
No 100s
|
DNF (injured)
|
Trent Briney
|
2:12
|
5:37
|
Not raced
|
Not raced
|
Not raced
|
Not raced
|
Not raced
|
Not raced
|
David
Riddle
|
2:26
|
5:40
|
Not raced
|
Not raced
|
DNF (Bad day)
|
6:45
|
Not raced
|
16:42
|
Ian
Sharman
|
2:32
|
5:50
|
6:00 (Bad day)
|
6:01
|
8:25
|
Not raced
|
12:44
|
15:54
|
Ann
Trason
|
2:39
|
Not raced
|
6:09
|
5:58
|
Not raced
|
7:00
|
Not raced
|
17:37
|
Ellie
Greenwood
|
2:42
|
6:12
|
6:18
|
6:08
|
9:04
|
7:29
|
Not raced
|
16:47
|
Emily
Harrison
|
2:32
|
6:17
|
Not raced
|
Not raced
|
Not raced
|
Not raced
|
Not raced
|
Not raced
|
Lizzy
Hawker
|
2:47 (2007)
|
Not raced
|
Not raced
|
6:48 (Up Run - slower course)
|
Not raced
|
7:29
|
Not raced
|
18:32 (Bad day)
|
*PRs are to the best of my knowledge, plus the help of Google
**UROC 100k 2012
had 10,000ft+ of ascent but it was largely on roads and hugely favored fast
marathoners who could also run trails
***Western
States 100 isn’t nearly as flat and fast as the other races but it’s the only
100 miler for some of the athletes to date
Before I get comments saying this isn’t a large enough
sample or it’s not scientific enough, I’ll mention that there aren’t enough
runners who’ve run around course records at several of these races to make direct comparisons plus weather
conditions play a huge part, especially on trails. More runners could have been
included but I’m doing this with a JFK 50 2012 slant and am trying to show the
really pointy end of the field, (plus myself for comparison because it’s my blog
and it gives me context).
 |
| Along the C&O Canal at JFK. Photo courtesy Ray Jackson Jr. |
Also, I'll point out that a great site for comparing race finish time for the entire field from race to race is RealEndurance.com. You can get an idea of your potential finish time in a race based on what other people managed at a given event who run at your speed in races you've already done.
What does that imply
for 100 milers?
The other reason for looking at these stats is that I’m sure a lot of people
are wondering what Max, Trent or Emily could run in a 100 miler. From
experience the correlation between fast shorter distance times and 100s is a
lot looser than between a marathon time and a race like JFK. Plus there’s a
clear trade-off between how much time a runner can spend on road speed and on
mountain endurance, although most would agree that these do complement to some
degree. Kilian isn’t going to run a 2:10 marathon off pure mountain running and
the Kenyans won’t run a 20 hour Hardrock 100 when their longest run is 2 hours
and at a much higher intensity. Of that I’m certain, although it’ll never be
tested (at the least they’d switch their training significantly if they went
for the races at the opposite end of the spectrum to their usual).
To run an average pace of 9 min/miles at Western States
means a lot more training at a slower speed than a marathoner would do. This is due to
the law of specificity, meaning that your body adapts to the training
stresses that are placed on it. If you want to run a fast marathon, a lot of
marathon-pace or faster running is required. If you want to sail up and down
mountains all day long, a large portion of training needs to simulate that.
When was the last time one of the really big, competitive
100 milers was won by a sub 2:30 marathoner? Doesn’t tend to happen at Western
States (please comment if you know who the last person was to manage this was
as it’s not any of the recent winners). UTMB is for pure mountain guys and many
of the top runners haven’t even run a road marathon. Never mind Hardrock – a
recent fast marathon time is almost (I’m exaggerating) a predictor of a bad run
as it implies too much time spent on the roads and not enough in the mountains
at altitude. It’s much more important to do a lot of vertical in training than
to be able to run the flatter sections at a 5 min/mile.
In summary, I don’t think there’s a very strong relationship
between mountain ultra success and a top end marathon time. I’m not going to
dust off the old economist’s tools (my previous life) and search for a huge pile of
data to find out which variables correlate to mountain ultra success. It’d cost
$20k to get a bunch of economists to do that analysis so I’m going to go out on
a limb and give you my non-scientific predictions of the key variables for a fast elite time
(relative to a world class runner for that style of race) at a given mountain 100-miler:
- Results at really similar 100 mile races or with similar aspects to the race in question
- Turning up completely uninjured with a long injury-free period pre-race for consistency in training
- Location – living close to terrain that’s similar to the race for training
- Frequency of DNFs – the fewer, the better
- Motivations – this’d be a hard one to model and would need truly honest answers to a questionnaire but someone who turns up with the aim of enjoying things first and competing second rather than caring more about records and winning with second place being deemed a ‘failure’
And factors that I think are somewhat correlated:
- Past success at the race in question in the recent past, but this could also build the pressure too much to cause bad pacing
- 100k or 50 mile mountain results
- Marathon time
- Age – Marco Olmo is probably the last guy around retirement to win a really major race but the peak age range is fairly wide
- Rippling six-pack/big guns – shows the runner does more training than just running all day, which is more important in an ultra than in shorter races. You wouldn’t pick a fight with Kami Semick and she’ll probably beat you in the race too…
100 mile records
So what about a flat 100-miler on a hard surface? There
really aren’t many that fit that description except on a track. Fast trail 100s like Rocky
Raccoon 100 (5,400ft of ascent) or Umstead 100 (8,000ft of ascent) are
still significantly slower than a flat road race of that distance. What do I
think the runners listed above could run on a flat road/track 100? Well, the
100k on roads gives an indicator but only covers the ‘easy’ bit of the race.
The male World Record for 100 miles is 11:28 by Oleg Kharitanov, pretty
much 3h marathon pace x4! I think Max and Trent have the pace to do that if
they altered their training to include a lot more miles at a pace they’d think
of as slow.
Ann Trason holds the female World Record of 13:47 which I think Ellie could run. Lizzie Hawker too.
But who’d want to run around a track all day? Well, I’ll
answer that in a month after I give it a go at the Desert Solstice 24h race in Arizona.